INFOGRAPHICS

Infographics serve a variety of functions. They make complicated information understandable to a larger audience by simplifying it. They are a useful tool for data storytelling since they can turn data into interesting stories. They also improve knowledge comprehension and engagement.
Infographics are a useful tool for quickly and efficiently conveying information.
They can draw in and keep the audience’s attention since they are captivating and visually beautiful.
Infographics are a useful tool for teaching people difficult subjects in a clear and concise manner.
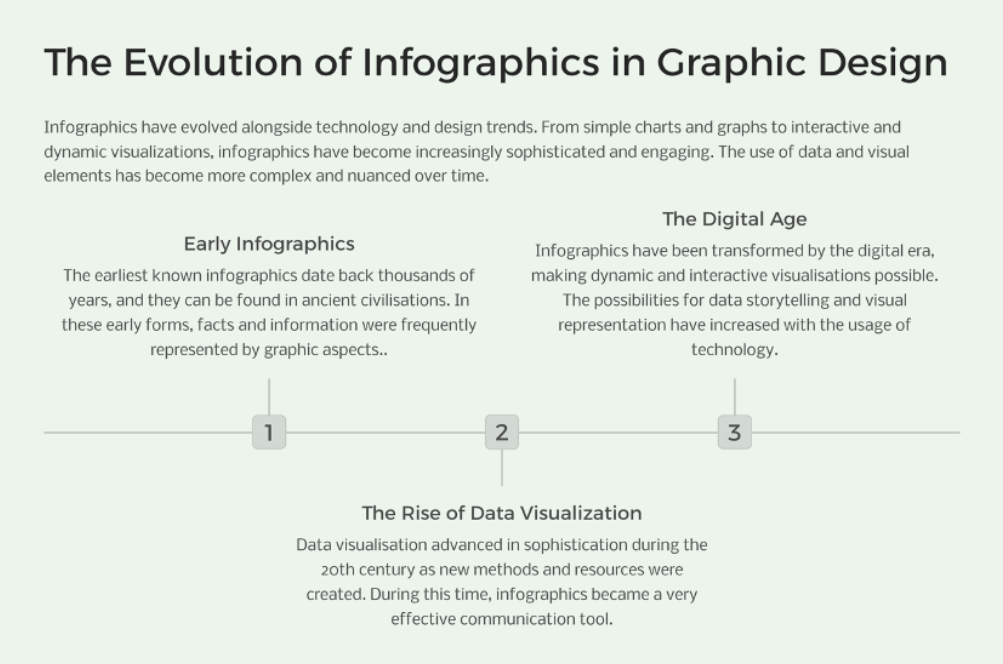
People can be convinced to act or have their opinions changed by using infographics. Infographics have changed in parallel with advances in technology and design. Infographics have evolved from straightforward graphs and charts to dynamic, interactive visualisations. They are now more complex and captivating than ever. Over time, the application of data and visual components has grown increasingly intricate and subtle
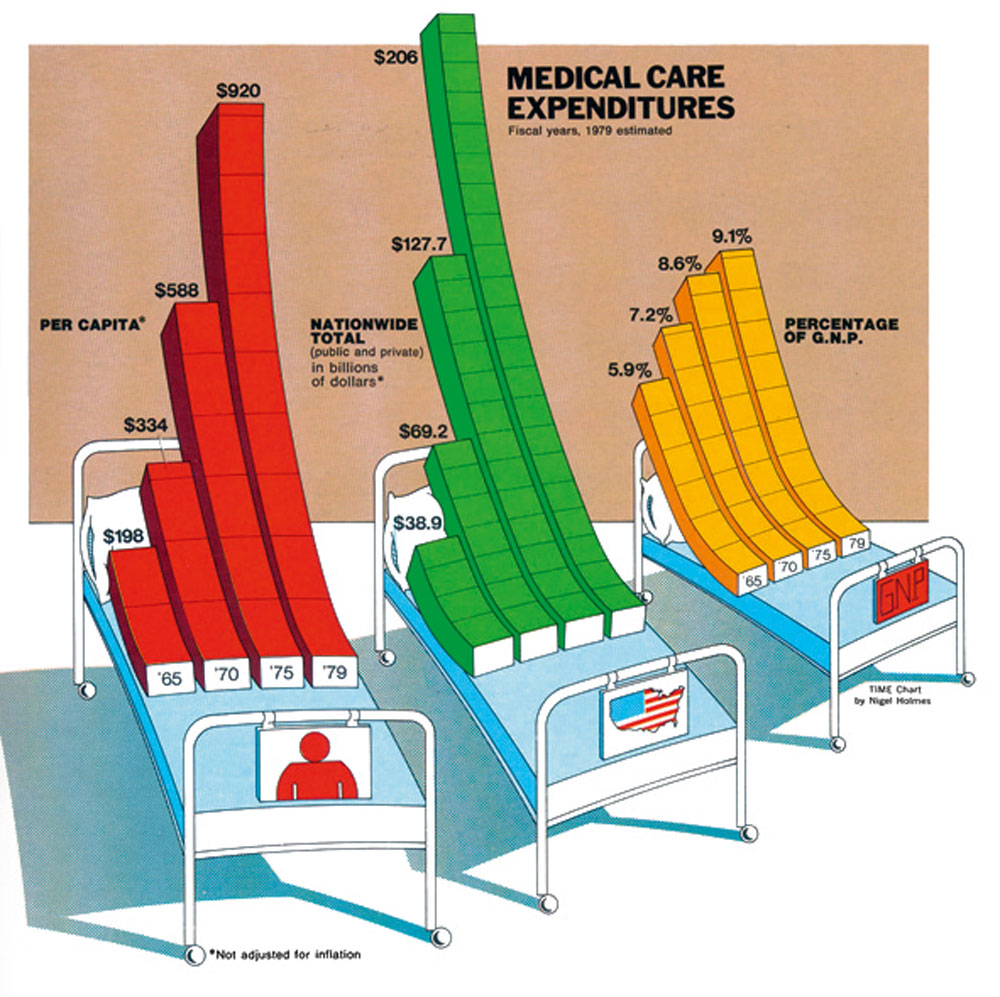
Nigel Holmes
Visual storytelling / simplification / visual clarity
Nigel Holmes is well-known for his informative visual creations. He is a firm believer in the use of images to simplify difficult subjects and make them accessible to a larger audience. His approach places a high value on unambiguous imagery and a clear story..
Holmes tells captivating tales with data using infographics, creating narratives that are both aesthetically pleasing and educational.
He focuses on reducing difficult information, making it accessible to a broader audience without sacrificing accuracy.
His infographics are made with simplicity in mind; they don’t include extraneous details and stick to a limited colour scheme
Nigel Holmes – Bio | Nigel Directory. (n.d.). Nigel.directory. https://nigel.directory/nigel-holmes/(2024). Staticflickr.com. http://farm9.staticflickr.com/8021/7183652371_75e0c4c206_o.jpg

Alberto Cairo
Truthful representation / clarity / accuracy
Renowned data visualisation specialist Alberto Cairo emphasises the significance of truthful and moral data display. He supports the production of factual, impartial, and eye-catching infographics.
Cairo is a firm believer in providing facts truthfully while avoiding manipulation or distortion.
He highlights how data visualisation has implications for ethics and how infographics should be responsible and free from incorrect interpretations. Cairo’s method places a high value on precision and clarity, making infographics simple to comprehend and free from misunderstandings. Cairo prioritises accurate and moral data presentation, but it also places a strong emphasis on producing visually stunning and captivating infographics.
Rogers, S. (2012, October 12). Data visualisation: how Alberto Cairo creates a functional art. The Guardian; The Guardian. https://www.theguardian.com/news/datablog/2012/oct/12/data-visualisation-alberto-cairo
Visual Hierarchy: Prioritising and directing the viewer’s attention are aided by the establishment of a distinct visual hierarchy.
Concise Language: It is ensured that the material is easy to understand and free of needless complexity by using plain and brief language.
Data Visualization: Selecting the right data visualisation methods guarantees accurate and effective data presentation.
Colour and Design: Thoughtful use of colour and design elements can improve readability and clarity